Skip to content
CBRE Advisory & Transaction Services · Retail · Ontario, CA+1 909 418 2041pablo.rodriguez1@cbre.com
Pablo RodriguezFirst Vice President, Retail

Market Insights

Inland Empire retail, Q3 2026

Demand held up and rents moved higher. Here are the numbers that matter for shopping center owners and retailers, and my take on what they mean.

6.7%Availability, down 20 bps from Q2
+501K SFNet absorption, up from -65K in Q2
$1.77Average asking rent, NNN per SF per month
$415.6MRetail investment sales in the quarter

What happened

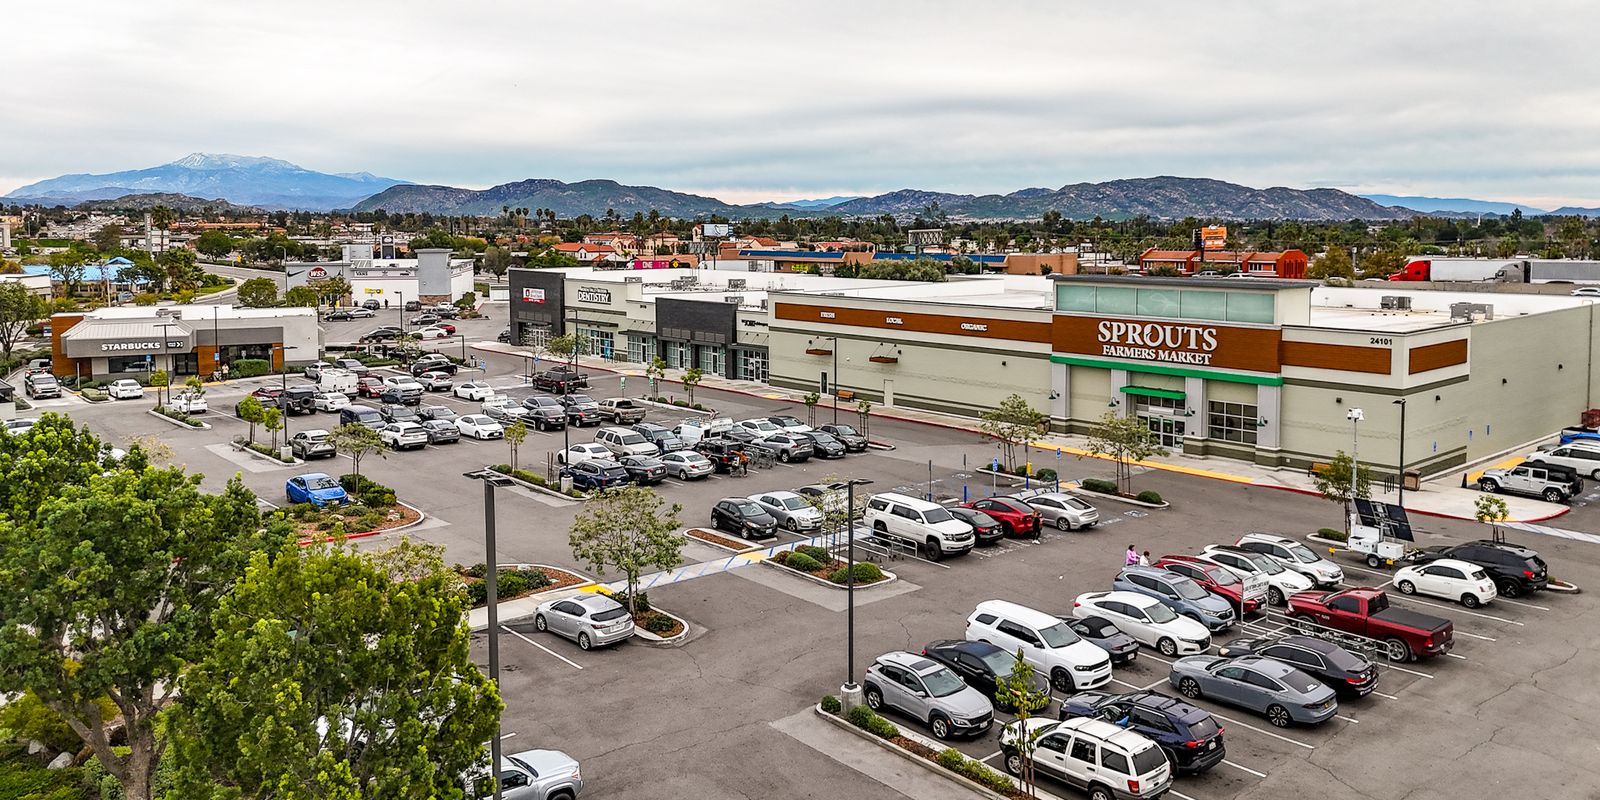
After a soft second quarter, the Inland Empire swung back to positive absorption, with every one of the seven submarkets in the black. Availability tightened to 6.7%, and average asking rents rose six cents to $1.77, with gains in five of seven submarkets. New supply stayed thin: about 169,000 SF delivered, most of it a single new center in South Riverside County.

Investment sales climbed to $415.6 million, up from $341.2 million in Q2. The Shoppes at Chino Hills ($156 million) drove much of the volume, and Costco bought Corona Hills Plaza. Average pricing came in around $174 per SF.

What it means for owners

With little new construction and steady tenant demand, well-located vacancies are leasing and landlords have room to push rents and limit concessions. If you have space coming back, it's a good time to get ahead of it. On the sale side, there is real buyer appetite for grocery-anchored and well-leased centers, and pricing is holding.

What it means for retailers

Good space is getting harder to find, especially pads and second-generation restaurant space. Start your search early and be ready to move when the right site opens up. I can show you what's coming available before it hits the market.

Download the full CBRE report (PDF)View on CBRE.com

Source: CBRE Research, Inland Empire Retail Figures Q3 2026. Commentary is my own.

Past reports
Southern California

More retail market reports

The latest CBRE Research retail figures for the other Southern California markets.

Q3 2026

Los Angeles County

6.1%Availability, unchanged from Q2
-83K SFNet absorption, down from +589K in Q2
$2.87Avg. asking rent NNN, down $0.04
$635.4MInvestment sales, up from $608.8M

Availability held at 6.1% as occupancy slipped after a strong second quarter. Only 12,000 SF delivered, and investment sales edged up to $635.4 million.

Q3 2026

Orange County

3.7%Availability, matching its record low
-114K SFNet absorption, down from +389K in Q2
$2.69Avg. asking rent NNN, up $0.13 to a five-year high
$267.8MInvestment sales, up from $138.8M

Space stayed scarce: availability held at a record-low 3.7% and rents hit a five-year high. Just 6,000 SF delivered, and sales nearly doubled, led by the $56.2 million Peninsula Marketplace sale.

Q2 2026

Ventura County

6.5%Availability, up 30 bps from Q1
-122K SFNet absorption, down from +10K in Q1
$2.29Avg. asking rent NNN, up $0.03
$22.7MInvestment sales, up from $20.0M

Occupancy dipped and availability rose to 6.5%, but rents kept inching up with no new deliveries. This is the most recent CBRE report for Ventura County.

Source: CBRE Research and CBRE Econometric Advisors.

Stay current

Get the report every quarter

I'll send the new numbers and my take when each quarter's report comes out. No spam.

Your details go only to Pablo Rodriguez, CBRE. Unsubscribe any time. See the privacy notice.

You're on the list. The next report will come straight to your inbox.